


If you want to measure your content marketing, you have to connect every single piece of content to a real, measurable business goal. Forget about chasing vanity metrics like "more traffic." Real success comes from defining clear Key Performance Indicators (KPIs) for each stage of your marketing funnel. This way, every blog post, video, or case study has a specific job and a clear way to prove its worth.
Setting Goals That Actually Connect Content to Business Growth

Before you can measure a thing, you have to define what "success" actually looks like for your brand. It’s a classic mistake: creating content without a clear objective, just hoping something will stick. This "spaghetti-at-the-wall" approach burns through time and money, and you're left with no way to show what you've accomplished.
So, the first real step in learning how to measure content marketing success is to ditch generic goals. Instead, you need a solid framework that ties your content directly to business outcomes.
This means every piece of content needs a job. Is it supposed to attract new people, generate qualified leads, nurture prospects who are already in your pipeline, or directly drive sales? The answer completely changes which metrics you should be watching.
Aligning Content Goals with the Marketing Funnel
The marketing funnel is your best friend here. It’s a simple but incredibly effective way to structure your goals. Each stage has a different objective, so you can tailor your content to what your audience needs at that exact moment.
-
Top of Funnel (ToFu) - Awareness: At this stage, your job is to get in front of a wide audience and simply introduce them to your brand. Your content should be educational and solve a problem, not push a sale.
-
Middle of Funnel (MoFu) - Consideration: Here, your audience knows they have a problem and they’re actively researching solutions. Your content should establish you as a trusted expert and help guide them.
-
Bottom of Funnel (BoFu) - Conversion: This is where decisions happen. The content needs to be specific and compelling—built to turn a prospect into a customer.
When you assign every piece of content to a funnel stage, you instantly clarify its purpose. A blog post titled “What Is a Faceless YouTube Channel?” is obviously a ToFu piece. A case study showing how a client bought a monetized YouTube account and got instant results? That’s pure BoFu.
From Goals to Actionable KPIs
Once you know where your content fits in the funnel, you can assign specific Key Performance Indicators (KPIs) to it. These are the hard numbers you’ll track to see if the content is actually doing its job.
For instance, a SaaS company writing a top-of-funnel article about "The Benefits of Automated Social Media Posting" shouldn't be judging its success on demo sign-ups. That’s a BoFu goal. They need to look at ToFu KPIs instead.
Here’s a practical look at how KPIs shift depending on the funnel stage:
Top of Funnel (Awareness) KPIs:
- Organic Traffic & Page Views: Are people finding this from Google?
- Keyword Rankings: Is the post climbing the search results for its target keywords?
- Social Shares & Mentions: Is it getting passed around and talked about on social media?
- Backlinks Earned: Are other credible sites linking to your content as a resource?
Middle of Funnel (Consideration) KPIs:
- New Email Subscribers: How many people downloaded a related checklist or signed up for your newsletter?
- Time on Page & Scroll Depth: Are visitors actually reading your detailed guides and comparisons?
- Click-Through Rate (CTR) on Internal Links: Are they clicking through to other relevant posts on your site, going deeper into your ecosystem?
Bottom of Funnel (Conversion) KPIs:
- Form Completions: How many demo requests or contact forms did this page generate?
- Downloads of Product-Specific Content: Are people downloading case studies, spec sheets, or pricing guides?
- Sales Attributed to Content: Can you use attribution tools to see if this content directly influenced a final sale?
By setting these specific, stage-appropriate KPIs before you hit publish, you create a clear scorecard for every piece of content. This simple shift transforms measurement from a confusing afterthought into a core part of your strategy, ensuring you can always prove the value of your hard work.
Gauging Audience Engagement and Brand Awareness

So, you've set your goals. Now for the real test: is anyone actually paying attention? Before we even think about leads or sales, we have to know if people are finding, reading, and interacting with our content. This is where top-of-funnel success begins.
These early-stage metrics aren't just for show. They're the vital signs of your brand's health, telling you if you're becoming more visible and if your message is actually connecting with people. Getting this right is the bedrock of a solid content strategy.
Interpreting On-Site Engagement Metrics with Nuance
Your website is ground zero for your content, and the data it gives you is pure gold—if you know how to read it. A "good" number for one article might be a huge red flag for another.
Take Bounce Rate, for example. It’s the percentage of people who land on a page and leave without clicking anywhere else. Everyone panics about a high bounce rate, but it’s not always a bad thing.
Imagine you wrote a post called, "How Long Does It Take to Monetize a YouTube Channel?" A visitor might land on it, get the answer in the first two sentences, and click away completely satisfied. In that case, a high bounce rate means you did your job well. You were efficient.
But if it's a pillar page designed to draw readers deeper into your site, a high bounce rate is a problem. It means the content wasn't engaging enough to make them stick around.
Key Takeaway: Never look at one metric in a vacuum. Always pair Bounce Rate with metrics like Time on Page and Scroll Depth. If a page has a high bounce rate but people are spending several minutes on it, they're clearly reading before they leave. That’s a win.
To give you a clearer picture, here’s a breakdown of the key metrics to focus on for awareness and engagement.
Key Metrics for Brand Awareness and Engagement
This table outlines the essential metrics for measuring top-of-funnel content success, what each metric indicates, and how to track it.
| Metric | What It Measures | How to Track It |
|---|---|---|
| Pageviews & Unique Visitors | The total reach of your content and how many distinct individuals you're attracting. | Google Analytics |
| Time on Page | How long visitors are actively consuming your content. Longer times suggest higher engagement. | Google Analytics |
| Scroll Depth | What percentage of the page visitors are actually seeing. It confirms they are reading, not just landing. | Tools like Hotjar or Google Tag Manager |
| Social Shares | How often your content is shared on social platforms, indicating it's valuable enough to endorse. | Social media platform analytics or tools like BuzzSumo |
| Comments & Mentions | The volume of conversation your content is generating. It's a direct line to audience sentiment. | Platform analytics, Google Alerts, or social listening tools |
Tracking these numbers together gives you a holistic view of whether your content is truly resonating with your audience.
Understanding Social Media's Role in Awareness
Social media is your brand's megaphone. Every like, comment, share, and save is a direct signal that your content is hitting the mark. It's so important that by 2025, it's expected that over 53% of marketers will count on social engagement as a primary measure of success.
These interactions push your content far beyond your own followers. A simple share is a powerful, personal recommendation to a whole new audience.
- Shares and Retweets: This is the ultimate compliment. It means someone found your content so good they were willing to share it with their own network.
- Comments and Replies: This signals active participation. It’s your chance to jump into the conversation, answer questions, and build a real community.
- Saves and Bookmarks: On platforms like Instagram, this is a huge indicator of value. It tells you people see your content as a resource they want to come back to. For many creators, figuring out how to earn from social media starts right here—creating save-worthy content.
When you see a spike in shares for a specific topic, that's your cue. If an infographic on TikTok trends gets a lot of traction, you know to create more visual, data-driven content like it.
Tracking Your Digital Footprint
Finally, you need to look beyond your own properties and see how your brand is showing up across the wider web. This means tracking your digital footprint.
- Brand Mentions: Use a tool like Google Alerts or the more advanced features in Ahrefs to get notified whenever someone mentions your brand, even if they don't link to you. It shows you're part of the conversation.
- Backlink Acquisition: When another credible site links to your content, it’s a massive vote of confidence for search engines. Keep an eye on new backlinks to see which articles are earning you the most authority.
By combining on-site behavior, social engagement, and your overall digital footprint, you get a 360-degree view of your top-of-funnel performance. This proves your content isn't just out there—it's actively building the brand awareness you need for long-term growth.
Connecting Content to Leads and Conversions

Likes and shares are great for visibility, but they don't pay the bills. The real gut-check for your content is its ability to turn an interested reader into a genuine lead. This is where we stop talking about awareness and start driving action.
Knowing how to measure content marketing success here means shifting your focus from "who saw it" to "who did something." These are the actions that show someone is moving deeper into your world and has real buying intent.
Identifying Your Key Conversion Actions
So, what does a "lead" actually look like for you? A conversion isn't one-size-fits-all. For a content creator, it might be a new email subscriber. For a SaaS company, it's a demo request. First thing's first: define what action you want people to take.
Some of the most common content-driven conversions are:
- Newsletter Sign-ups: This turns a one-time visitor into a long-term contact you can nurture.
- Lead Magnet Downloads: Think ebooks, checklists, or templates that people are willing to trade their email for.
- Webinar Registrations: Perfect for capturing leads who want a more in-depth, interactive experience.
- Contact Form Submissions: A crystal-clear signal that someone wants to talk to you directly.
- Demo or Consultation Requests: For many service or software businesses, this is the ultimate bottom-of-funnel goal.
Your best friends for tracking this are your marketing automation platform and Google Analytics 4 (GA4). By setting up specific goals in GA4 for each conversion, you can see exactly which blog posts or landing pages are doing the heavy lifting.
Don’t just count the number of conversions. You have to connect the dots. Did that viral TikTok video actually drive newsletter sign-ups? Did a specific blog post lead to three demo requests last month? That’s the kind of detail that tells you where to put your energy.
Designing Lead Magnets That Actually Convert
A lead magnet is a simple value exchange. You want their contact info, so you have to offer something genuinely useful in return. A generic, slapped-together PDF just won’t cut it anymore.
The best lead magnets feel like a natural next step from the content they’re paired with. For instance, if you write an article on "The Best Niches for Faceless YouTube Channels," a killer lead magnet would be a downloadable checklist titled "Your First 10 Faceless Video Ideas." It's exactly what the reader needs next.
Think about a common pain point your audience has and offer a quick win. Your lead magnet should be:
- Specific and Actionable: It needs to solve one focused problem.
- Easy to Consume: A one-page checklist is often far more effective than a 50-page ebook.
- Instantly Accessible: Deliver it right away. Instant gratification is key.
As you build out your content strategy, understanding the numbers behind it all is crucial. To really get a handle on the success of your lead-generating content, you need to master your lead generation performance metrics.
Crafting Calls-to-Action and Landing Pages That Work
Your Call-to-Action (CTA) is the bridge between your content and the conversion. It has to be clear, compelling, and feel like the obvious next step. Please, stop using generic phrases like "Click Here" or "Download Now."
Instead, use action-oriented language that spells out the benefit.
-
Instead of: "Download our ebook."
-
Try: "Get your free video idea checklist."
-
Instead of: "Subscribe."
-
Try: "Join 10,000+ creators and get weekly tips."
These CTAs should send users to a dedicated landing page. This page has one job and one job only: to convert. A good landing page is ruthlessly focused. No navigation bar, no social media links, no other distractions. Just a clear offer, a breakdown of the benefits, and a simple form.
By connecting your great content to targeted lead magnets with clear CTAs and focused landing pages, you build a powerful, repeatable system for generating leads. It’s a foundational step in monetizing your audience, a principle that works across platforms. In fact, it's a key part of learning https://monetizedprofiles.com/blogs/monetization-on-social-media/how-to-monetize-social-media-top-7-proven-tips. This process is what turns your content from a simple blog or social feed into a reliable engine for business growth.
Proving Content Marketing ROI and Sales Impact
Alright, this is the moment of truth. You’ve successfully driven traffic, sparked engagement, and even captured some quality leads. But now comes the question from the C-suite, especially your CFO: “What’s the actual return on our content investment?” This is where the rubber meets the road, where you connect your content efforts directly to the bottom line.
To measure success at this level, we have to move beyond typical marketing metrics. We need to start speaking the language of the business—revenue, cost, and profit. This is how you build an undeniable case for your content program and secure the budget needed to keep growing.
Calculating Your Content Marketing ROI
Calculating your Return on Investment (ROI) sounds intimidating, but the formula itself is pretty straightforward. At its core, it's just about comparing what you earned from your content against what you spent to create and promote it.
The basic formula is: (Revenue from Content - Cost of Content) / Cost of Content x 100 = ROI %
Let's walk through a real-world example. Imagine you created a series of blog posts and a companion ebook that cost a total of $3,000. This includes everything—writer fees, design work, and any ad spend to promote it. Over the next six months, you track the leads from that content, and they result in $15,000 in new business.
Here's how the math breaks down:
- ($15,000 - $3,000) / $3,000 = 4
- 4 x 100 = 400% ROI
A 400% return is a powerful number to bring into any meeting. It clearly shows that for every dollar you put into content, you got four dollars back. If you want a more detailed framework, our guide on the ROI of content marketing offers a complete walkthrough.
Pro Tip: Don't forget to consider Customer Lifetime Value (CLV). A new customer might only spend $500 on their first purchase, but if their average CLV is $5,000, your content's true, long-term impact is much more significant.
Demystifying Revenue Attribution Models
The trickiest part of that ROI equation is figuring out the "Revenue from Content" piece. How do you really know which blog post or video gets the credit for a sale? This is where attribution models come into play. Think of them as the rulebooks that assign value to the different touchpoints a customer interacts with on their path to purchase.
Choosing the right model is critical and depends entirely on your sales cycle and business goals.
The infographic below shows just how much key metrics can shift from one quarter to the next, which really drives home the importance of consistent tracking.
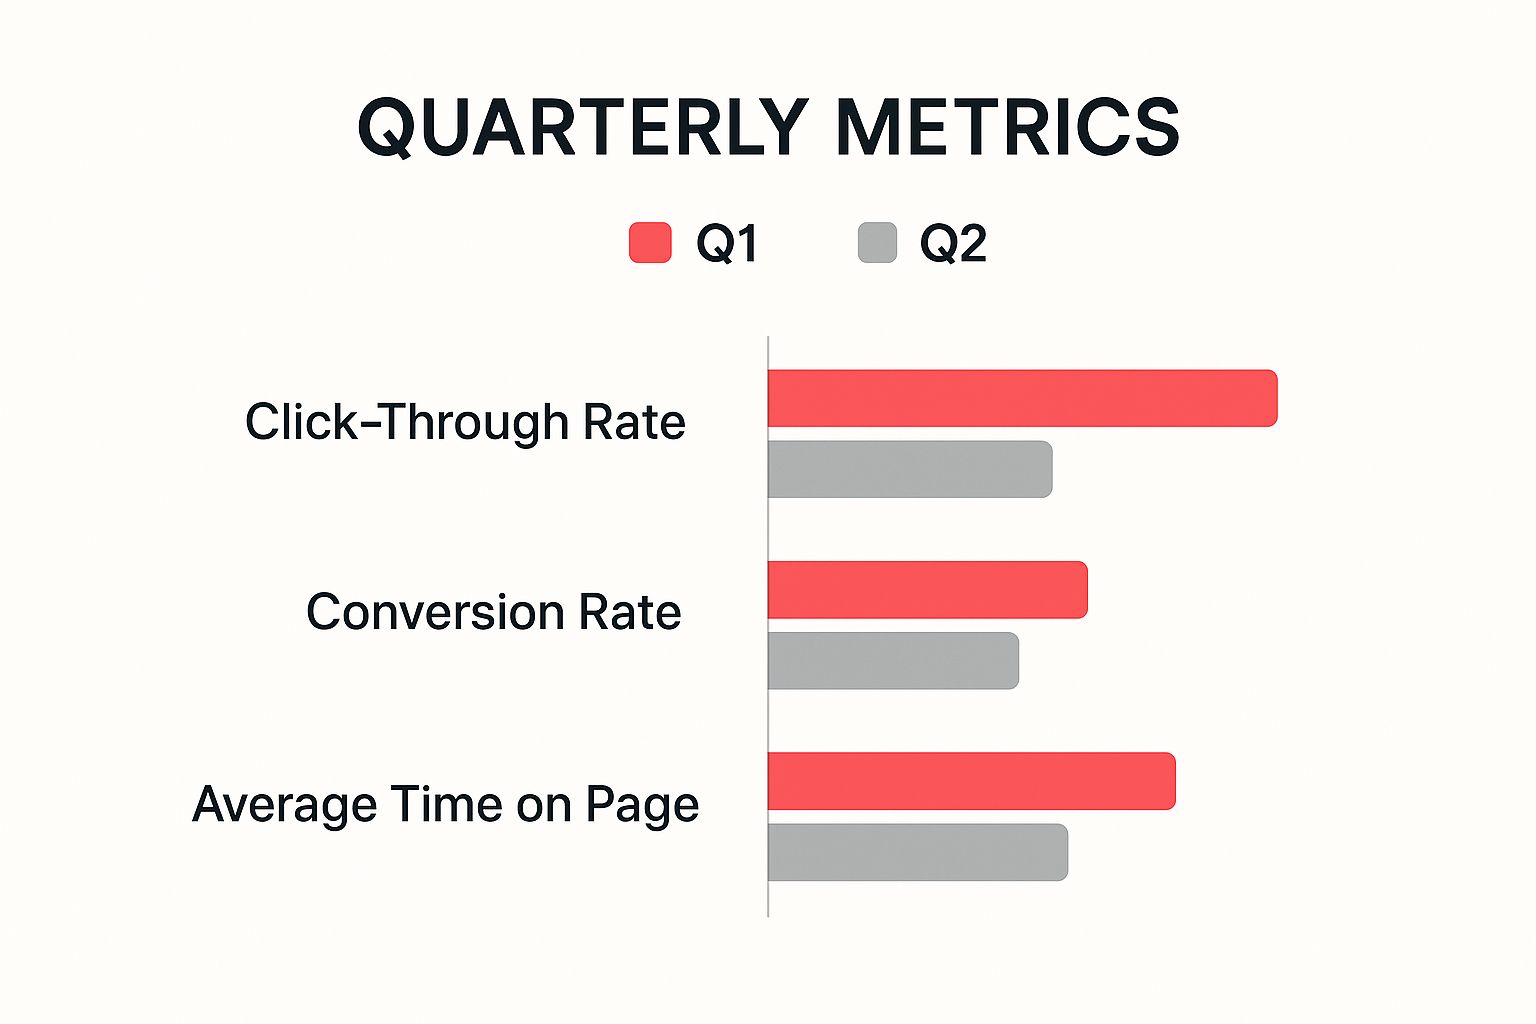
As you can see, a deliberate focus on optimizing content in Q2 led to a higher conversion rate. Even though time-on-page dipped slightly, the data proves that our adjustments paid off where it counts.
Choosing the Right Attribution Model
There isn't a single "best" attribution model. The right one for you depends entirely on your marketing strategy and how your customers actually buy from you. A quick impulse buy for a t-shirt is worlds away from a six-month B2B sales cycle for enterprise software.
Here’s a quick breakdown of the most common models to help you decide.
| Attribution Model | How It Works | Best For |
|---|---|---|
| First-Touch | Gives 100% of the credit to the very first piece of content a customer interacted with. | Businesses focused on top-of-funnel awareness and understanding which channels bring in new prospects. |
| Last-Touch | Assigns 100% of the credit to the final touchpoint before the conversion. | Companies with short sales cycles where the final piece of content is the most influential. |
| Linear | Distributes credit equally across all touchpoints in the customer's journey. | Marketers who want to value every interaction and understand the full path to purchase. |
| Time-Decay | Gives more credit to touchpoints that happened closer to the time of conversion. | Long consideration cycles where recent interactions are likely more impactful than initial ones. |
| U-Shaped (Position-Based) | Gives 40% of the credit to the first touch, 40% to the last touch, and divides the remaining 20% among the middle touches. | Teams that value both the initial awareness-driving content and the final conversion-driving content. |
My advice? If you're just starting out, begin with a simple model like last-touch. It’s the easiest to set up and track. As your analytics get more sophisticated, you can experiment with multi-touch models like Linear or U-Shaped to get a more holistic view of how your content ecosystem drives sales.
To really nail this, you have to be diligent about tracking the right data. It’s worth exploring these 8 essential content marketing metrics to track to make sure you're focusing on what truly matters.
Building Your Content Measurement Tech Stack
https://www.youtube.com/embed/_rm4SNmhDXA
Having the right data all comes down to having the right tools. While your goals are the "why" behind your measurement strategy, your tech stack is the "how." A well-chosen set of tools gives you the infrastructure to gather, analyze, and actually act on performance data. Without it, you're flying blind.
The good news? You don't need a massive, enterprise-level budget to get started. A few core tools, when used correctly, can unlock powerful insights into your content's performance. The trick is to understand what each tool is for and how they all work together.
The Three Pillars of Your Stack
I like to think of a solid measurement tech stack as having three essential pillars. Each one answers a different, critical question about your content, from how people find it in the first place to whether it actually influences a sale.
- Web Analytics Platform: This is your home base for everything happening on your site. It answers: What are people doing on our website?
- SEO Platform: This tool pulls back the curtain on your search engine visibility. It answers: How are we performing on Google?
- Customer Relationship Manager (CRM): This is the final piece that connects content to leads and revenue. It answers: Is our content driving real business results?
When you integrate these three types of tools, you get a complete picture of your content's journey. You can see how a high-ranking blog post (tracked in your SEO tool) brings in website traffic (seen in web analytics) that eventually becomes a qualified lead (managed in your CRM).
Mastering Web Analytics for Content Insights
For most of us, the go-to web analytics platform is Google Analytics 4 (GA4). It’s free, incredibly powerful, and the industry standard. But simply installing the tracking code isn't enough. If you want to truly understand how to measure content marketing success, you have to move beyond just glancing at traffic numbers.
The real magic of GA4 is in its customization. Instead of getting stuck in standard reports, you can build custom "Explorations" to track the specific goals your content is designed to achieve.
- Real-world scenario: Let's say you just launched a new lead magnet—a checklist for faceless video ideas. In GA4, you can create a funnel exploration report that shows you exactly how many people landed on the blog post promoting it, clicked the download link, and completed the form. This instantly reveals the conversion rate of that specific content funnel.
Of course, social media analytics often feed into this broader picture. To track performance efficiently, a centralized analytics dashboard is a huge help. For a deeper look at this, check out this complete social media analytics dashboard guide to see how you can pull all those insights together.
Using SEO Tools for Performance Tracking
Your content can be brilliant, but it’s useless if no one can find it. This is where SEO platforms like Ahrefs or Semrush become essential for monitoring your organic performance. They show you precisely how your articles are impacting your visibility where it matters most: on search engines.
To use these tools for content measurement, I recommend focusing on these key areas:
- Keyword Rank Tracking: Are your posts climbing the search engine results pages (SERPs) for your target keywords? A steady climb is one of the clearest signs of success.
- Backlink Acquisition: Are other credible websites linking to your content? Each new, high-quality backlink is a vote of confidence that boosts your authority. You can even set up alerts to see which articles are earning the most valuable links.
- "Content Gap" Analysis: These tools are fantastic for showing you what keywords your competitors rank for that you don't. This insight is gold for planning your next round of content.
By actively monitoring these SEO metrics, you're not just creating content; you're strategically building a library of assets that consistently drive organic traffic and establish your brand as an authority in your niche.
Connecting Content to Revenue with Your CRM
Finally, your Customer Relationship Manager (CRM) is where you close the loop. Tools like HubSpot or Salesforce are what tie your content marketing efforts directly to leads and, ultimately, revenue.
When you integrate your CRM with your website, you can attribute sales back to the specific content that influenced them. Imagine a potential customer reads three of your blog posts, downloads an ebook, and then finally requests a demo. A properly configured CRM can track that entire journey. This means you can report that those blog posts and that ebook collectively contributed to a new sale, proving their tangible business value.
This is the final, most important step in showing the full impact of your content program.
Common Questions About Measuring Content
Even with the best plan in place, you’re going to hit some tricky spots when you start measuring your content's impact. These are the kinds of practical, in-the-weeds questions that pop up all the time. Let's break down a few of the most common ones I hear.
How Long Should I Wait Before Measuring a Piece of Content?
This is probably the number one question people ask. Is a week enough time? A month? A year?
Honestly, it all comes back to the content's job and how you're promoting it.
If you’re looking at a social media post or something tied to a quick campaign, you'll know if it's a dud or a star pretty fast—usually within 48 to 72 hours. But for an SEO-driven blog post, you’re playing a much longer game. It can easily take 3-6 months for a new article to climb the Google rankings and start pulling in steady organic traffic.
I see this mistake all the time: someone kills a blog post after a month because it “isn’t working.” Patience is a non-negotiable part of SEO. You have to give that evergreen content time to breathe and build value.
What if My Content Doesn't Have a Direct CTA?
So, what about the content that doesn’t ask for a sale? Think about a brand story video or a simple top-of-funnel article answering a user's question. You know it has value, but proving it without a direct conversion can feel impossible.
This is where you have to get comfortable with "proxy metrics." These are clues that tell you you're moving people in the right direction, even if they aren't filling out a form right away.
Here are a few to watch:
- Assisted Conversions: Jump into your Google Analytics 4 "Conversion paths" report. You might be surprised to find that a blog post was the very first touchpoint for a user who eventually came back and converted through another channel.
- Brand Search Lift: After you launch a big piece of content, keep an eye on your branded search volume. Are more people searching for your company name directly? That’s a great sign that your content is building brand recall.
- Engagement Rate: For videos and social content, look at things like watch time, shares, and saves. These metrics show that your content is hitting the mark and building an audience—a critical first step toward any future conversion.
It helps to think of it like a sports team. Not every player is the top scorer. Some are there to set up the shot, creating the opportunity for another piece of content to seal the deal.
Should I Bother Tracking Vanity Metrics at All?
"Vanity metrics" get a bad rap, and for good reason—things like raw pageviews or social media followers don’t directly pay the bills. But that doesn't mean you should ignore them completely.
The trick is to use them as directional signals, not as your final report card.
For instance, a sudden, unexpected spike in pageviews on a year-old blog post is a valuable clue. It tells you something’s up. Maybe it got a shoutout in a big newsletter, or a new keyword just started ranking. That’s your cue to dig in and ask:
- Can we update this post with a stronger call-to-action to capture this new audience?
- Is this topic suddenly trending? Should we create more content around it?
Use vanity metrics as your smoke alarm. They alert you to opportunities (or problems), pushing you to ask better questions and find real, actionable answers. Think of them as the start of an investigation, not the conclusion.
Ready to skip the slow grind and start earning from your content immediately? MonetizedProfiles offers fully approved TikTok and YouTube accounts that are ready to generate revenue from day one. It's the ultimate shortcut for serious creators. Find your monetized account today.


